


Healthcare in Rural New York: Current Challenges and Solutions for Improving Outcomes
Policy Brief by Sally Dreslin

Introduction
Rural communities share some of the same challenges related to the issues of healthcare access and provider sustainability, but there are unique dynamics in rural areas, and the solutions must be shaped differently than those for urban areas. In this Policy Brief, we examine some of the wide-ranging health challenges that New York’s rural communities are facing; describe the extent and the drivers of the growing gap in mortality rates between rural and urban populations nationally and in New York; describe the state of rural healthcare delivery in general; and present promising alternative models for the delivery of healthcare in rural communities nationally, as well as in New York.
Rural hospitals are struggling with the high cost of supplies and labor costs, technology, the need to staff emergency services 24 hours per day despite low volume, and aging infrastructure that hampers their ability to modernize service delivery to better meet their patients’ needs and to maximize reimbursement.[1] As the Step Two Policy Project has discussed in our previous Policy Brief related to fiscally distressed hospitals statewide, titled The Challenge of Financially Distressed Hospitals in New York, rural hospitals frequently suffer from the lack of economies of scale, aging physical plants with inefficient infrastructure, and lack of market power with payers. These structural inefficiencies present significant challenges to financial sustainability.
In addition to limited hospital services, rural areas in New York face limited numbers of adult care facilities and nursing homes. These facilities are often used for short-term rehabilitation following an acute care hospital stay, in addition to the long-term stays that result when the individual can no longer remain in their home. The large geographic regions, lack of public transportation, shortage of primary and specialty care practitioners, limited home healthcare workforce, and absence of younger family members can all pose healthcare access challenges for older adults and people with disabilities in New York’s rural counties.
In addition to challenges of acute care, long-term care services and supports, and primary care, pre-hospital emergency services are strained in rural New York. Response times can be slow due to geographic distance and a shortage of EMS personnel. In 2017-18 in Sullivan County, “it was not unusual in more rural portions of the county to experience response times greater than 20 minutes,” [2] compared to the average response time in rural zip codes nationally in 2015 of 14.5 minutes.[3]
In September 2023, the New York State Comptroller produced a report titled, Rural New York: Challenges and Opportunities. The report explores the challenges faced by rural New Yorkers and focuses on ten rural New York counties that share many characteristics with other New York counties with low population or low population density across the State.[4] The report identifies four foundational challenges for rural communities:
low population density with widely distributed housing and services that hamper efforts to achieve economies of scale
reliance on personal vehicles that results from a lack of public transportation – this reliance may disproportionately impact older adults and individuals with disabilities, but it also contributes to a general burden of vehicle maintenance, insurance, and fuel costs
declining labor force and shrinking affordable housing as populations contract and age, and as rural areas increasingly become seasonal or recreational destinations for more affluent, transient populations
the persistence of challenges shared by the rest of the State, but that may be particularly challenging to address in rural communities, e.g., the opioid epidemic and food insecurity.
Almost all the counties the Comptroller focuses on are federally designated healthcare shortage areas, e.g., health professional shortage areas, medically underserved areas, and/or home to medically underserved populations.[5] Residents in three of the ten counties, per the Report, rely on neighboring counties to access hospital services, and in those counties that do have hospitals, services like obstetrics or behavioral health continue to diminish or be discontinued.
It is important to appreciate the different nature of the challenges and potential solutions to accessing healthcare services for rural New Yorkers compared to urban and suburban New Yorkers. This Policy Brief seeks to identify approaches that support the rural healthcare delivery system. These approaches include innovative models for delivering care both within and outside of hospitals, collaborations with emergency medical services, maximizing healthcare workforce scope of practice flexibility, as well as economic development and infrastructure improvements. These rural-focused solutions also include policies that promote accessibility to services in rural counties, such as telehealth and remote patient monitoring (and ensure the availability of reliable internet with sufficient bandwidth to support these services), in addition to transportation and mobile service delivery.
A Note on the Chartbook
In the associated Chartbook to this Policy Brief, Disparities in Rural and Urban Mortality: New York State Chartbook, the Step Two Policy Project has reproduced several of the Figures and Tables included in a March 2024 report from the USDA Economic Research Service authored by K. Thomas and colleagues, using the CDC’s WONDER Multiple Cause of Death, 1999-2020 database, but we have focused on New York-specific data and have broadened the analyses to include all ages, in addition to working ages. As with Thomas, et al.’s analyses, we have not included the available mortality data for the COVID-19 years. There is existing literature that indicates morbidity and mortality related to COVID-19 was greater in rural areas nationally, but we have not explored that in this Policy Brief.[6]
In addition to the analyses of rural-urban COVID-19 morbidity and mortality, there have been analyses examining the ethno-racial differences in external-cause mortality during the early years of the COVID-19 pandemic, for example, Ethnoracial Disparities in Rates of Non-Natural Causes of Death After the 2020 COVID-19 Outbreak in New York State. In many cases, the race and ethnicity data for rural New York mortality rates include values that are small and thus cell-suppressed and labeled as “unreliable” in the CDC WONDER database. We have attempted to examine mortality rates among rural New Yorkers by including as many factors as we can, given these limitations on the publicly available data.
Rural Mortality Compared to Urban
Background
Natural-cause mortality (NCM) is a key metric in public health, serving as a barometer for population well-being and guiding efforts to improve health outcomes through interventions and policy development. There are disparities in health outcomes and mortality rates between urban and rural populations, and in recent years, the magnitude of the disparities has grown.[7] Dr. Macarena Garcia, the lead author for the CDC Morbidity and Mortality Weekly Report (MMWR) titled Preventable Premature Deaths from the Five Leading Cases of Death in Nonmetropolitan and Metropolitan Counties, United States, 2010 – 2022, explained in April 2024 that, “[T]here is a well-described, rural-urban divide in the United States, where rural residents tend to be sicker and poorer and to have worse health outcomes than do their non-rural peers.”[8] A March 2024 report from the USDA Economic Research Service authored by K. Thomas. Thomas and her colleagues examined publicly available data from the Centers for Disease Control and Prevention (CDC) WONDER database. They queried mortality data from many perspectives, including age, sex, race, ethnicity, and cause of death. They explain that in 2019, the age-adjusted, natural-cause mortality rate[9] for the “prime working-age population,” those ages 25-54 years old, was 43 percent higher in rural areas than in urban areas, compared to 1999, when the NCM rate for those age 25-54 years was just six percent higher in rural areas than in urban areas.
The change resulted from a decrease in the NCM rate in urban areas, signaling improving population health, combined with an increase in rural areas, signaling worsening population health among this age cohort in these areas. The age-adjusted NCM for the overall population, i.e., all ages, in rural areas in 2019 was 20 percent higher than in urban areas, compared to in 1999, when the gap was six percent.
Some additional key findings from the national report include:
In rural areas, natural-cause mortality rates for prime working-age females increased more than natural-cause mortality rates for prime working-age males between the 1999–2001 and 2017–2019 periods.
The urban-rural gap in prime working-age natural-cause mortality rates grew in all [census] regions between 1999–2001 and 2017– 2019, with the Midwest having the smallest increases.
The South continued to have the highest prime working-age natural-cause mortality rates for both sexes in 2017–2019, while the Northeast continued to have the lowest rates.[10]
Key Takeaways for New York from the CDC WONDER Data
Over the last 20 years, while mortality rates in general have declined in both rural and urban New York, the difference in mortality rates from all causes, among all ages, has increased between rural and urban areas. In 1999, the rural, age-adjusted, all-cause, all-ages mortality rate was six percent higher than in urban areas, and in 2019, the rural rate was 13 percent higher. For working-age, rural New Yorkers the same rate went from two percent higher in 1999 to 18 percent higher by 2019 (Chartbook, pages 14-15).
The age-adjusted, natural-cause mortality rate for rural, working-age New Yorkers was two percent lower than for urban New Yorkers in 1999, and by 2019, it was 19 percent higher. For prime working-age, rural New Yorkers, the natural-cause mortality rate went from four percent lower than for urban New Yorkers in 1999, to 19 percent higher than urban New Yorkers by 2019 (Chartbook, pages 18-19).
Consistent with the national findings above, New York’s rural, prime working-age population is the only group to experience an increase in natural-cause mortality between the two time periods we compared. Specifically, between 1999-2001 and 2017-2019, the age-adjusted, natural-cause mortality rate for those of prime working-age decreased by 23 percent for urban New Yorkers and increased by two percent for rural New Yorkers (Chartbook, page 23).
Also consistent with the national findings discussed earlier, prime working-age, rural female New Yorkers appear to drive the increase in natural-cause mortality rates. Specifically, between 1999-2001 and 2017-2019, natural-cause mortality rates decreased by 23 percent for urban, female New Yorkers of prime working-age but increased by 83 percent for their rural female counterparts; natural-cause mortality rates decreased among both urban and rural prime working-age males, although more so for urban than rural males (Chartbook, page 26).
In addition to increased rates of age-adjusted, natural-cause mortality among rural, female New Yorkers, prime working-age rural females saw the most significant increases in external-cause mortality rates compared to prime working-age rural males and to urban females and males (Chartbook, page 26).
In the accompanying Chartbook, we examine some of the natural-cause and external-cause drivers of these increased rates.
Findings from the New York Data
All-cause mortality - The age-adjusted all-cause mortality rate for the overall population (i.e., all ages) in rural New York in 2019 was 13 percent higher than in New York’s urban areas compared to 1999, when the gap was six percent (Chartbook Page 14). For working-age (ages 15-64) New Yorkers in 1999, the age-adjusted all-cause mortality rate in rural areas was two percent higher than in urban areas, and by 2019, it was 18 percent higher in rural areas than in urban areas (Chartbook Page 15).

Natural-cause mortality - The age-adjusted, natural-cause mortality rates for all ages decreased in both rural and urban areas from 1999 to 2019, but the rate decreased by 17 percent in New York’s rural areas, compared to a 25 percent decrease in urban New York (Chartbook Page 17). For New Yorkers of all ages in 1999, the age-adjusted natural-cause mortality rate in rural areas was four percent higher than in urban areas, and by 2019, it was 13 percent higher than in urban areas. (Chartbook Page 17).

For prime working-age (ages 25-64) New Yorkers, the age-adjusted natural-cause mortality rate in rural areas was four percent lower than in urban areas in 1999, and by 2019, it was 19 percent higher than in urban areas (Chartbook Page 19). In rural areas, the age-adjusted prime working-age, natural-cause mortality rate increased by three percent from 1999 - 2019, but in urban areas, there was a 20 percent decrease during the same 20 years. (Chartbook Page 19).

Female New Yorkers - For rural, female New Yorkers, the age-adjusted, natural-cause mortality rate for all ages decreased by 12 percent between 1999-2001 and 2017-2019 and the external-cause mortality rate increased by 34 percent, compared to female New Yorkers in urban areas, where the age-adjusted, natural-cause mortality rate for all ages decreased by 22 percent between 1999-2001 and 2017-2019 and the external-cause mortality rate increased by 54 percent between the two time periods. (Chartbook Page 24).
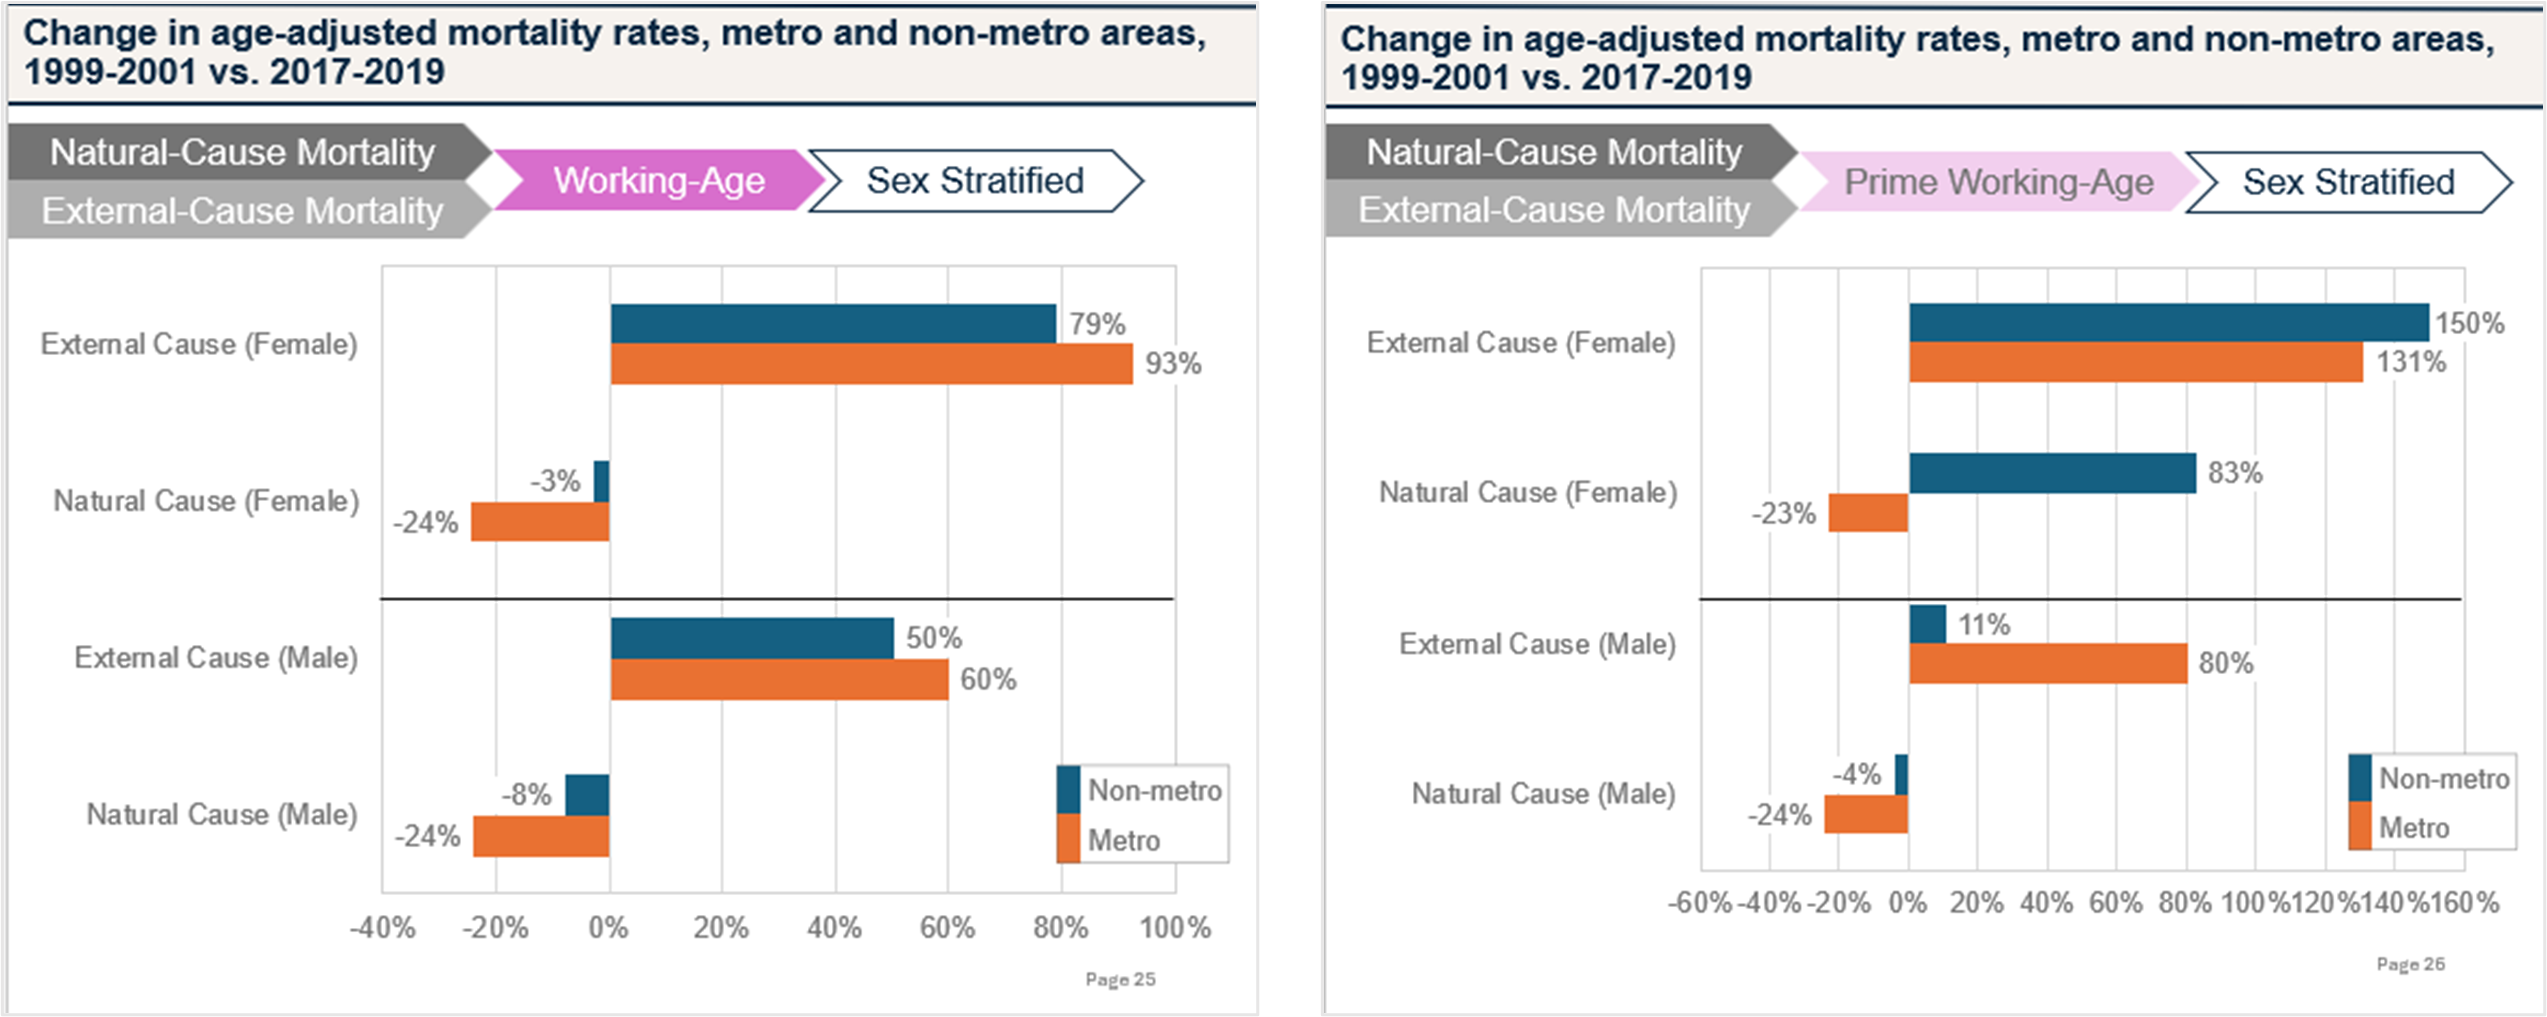
For rural, female New Yorkers, the age-adjusted, working-age, natural-cause mortality rate for all ages decreased by 3 percent between 1999-2001 and 2017-2019, and external-cause mortality increased by 79 percent. For female New Yorkers in urban areas, the age-adjusted, working-age, natural-cause mortality rate decreased by 24 percent between 1999-2001 and 2017-2019 and the external-cause mortality rate increased by 93 percent between the two time periods. (Chartbook Page 25).
For rural, female New Yorkers, the age-adjusted, prime-working-age, natural-cause mortality rate increased by 83 percent between 1999-2001 and 2017-2019, and external-cause mortality increased by 150 percent. For female New Yorkers in urban areas, the age-adjusted, prime-working-age, natural-cause mortality rate decreased by 23 percent between 1999-2001 and 2017-2019 and the external-cause mortality rate increased by 131 percent between the two time periods. (Chartbook Page 26).
Male New Yorkers - For rural, male New Yorkers, the age-adjusted, natural-cause mortality rate for all ages decreased by 21 percent between 1999-2001 and 2017-2019 and the external-cause mortality rate increased by 32 percent, compared to male New Yorkers in urban areas, where the age-adjusted, natural-cause mortality rate for all ages decreased by 25 percent between 1999-2001 and 2017-2019 and the external-cause mortality rate increased by 43 percent between the two time periods (Chartbook Page 24).
For rural, male New Yorkers, the age-adjusted, working-age, natural-cause mortality rate decreased by 8 percent between 1999-2001 and 2017-2019 and external-cause mortality rate increased by 50 percent, compared to male New Yorkers in urban areas, where the age-adjusted, working-age, natural-cause mortality rate decreased by 24 percent between 1999-2001 and 2017-2019 and the external-cause mortality rate increased by 60 percent between the two time periods (Chartbook Page 25).
For rural, male New Yorkers, the age-adjusted, prime-working-age, natural-cause mortality rate decreased by 4 percent between 1999-2001 and 2017-2019 and external-cause mortality increased by 11 percent, compared to male New Yorkers in urban areas, where the age-adjusted, prime-working-age, natural-cause mortality rate decreased by 24 percent between 1999-2001 and 2017-2019 and the external-cause mortality rate increased by 80 percent between the two time periods (Chartbook Page 26).

To read the rest of the Policy Brief and the Disparities in Rural and Urban Mortality: New York State Chartbook, visit our website here.
Below is the Table of Contents for the full Policy Brief:
Introduction
A Note on the Chartbook
Rural Mortality Compared to Urban
Background
Key Takeaways from the New York Data
Findings from the New York Data
The State of Hospitals and Healthcare Services in Rural Areas
The National Experience
The Rural New York Experience
Population, Land Area, and Premature Death Rate of Rural New York
Social, Economic, and Infrastructure Characteristics of Rural New York
Poverty in Rural New York
Access to Broadband Service in Rural New York
Access to Fluoridated Drinking Water in Rural New York
Access to Healthcare Services in Rural New York
Hospitals
Primary Care
Dental Care
Behavioral Healthcare
Pharmacy Services
North Country Health Systems Redesign Commission
Core Essential Healthcare Services
Rural Hospitals
Special Classifications
Recommendations of the AHA Future of Rural Health Care Task Force
Public and Private Funding for Core Services and Improved Business Operations
Examples in New York
State Funding Programs to Support Rural Hospital Operations, Infrastructure, and Transformation
Global Budgets
Strategic Partnerships and Affiliations in Rural New York
Maternity Care
Highlighting Models in Rural Primary Care, Dental Care, Behavioral Health, and Cancer Care
Models of Primary Care, Behavioral Healthcare, Maternity Services, Dental Care, and EMS in Rural New York
Workforce Solutions
Recommendations
Physical Infrastructure
Collaboration
Reimbursement/Business Operations/Information Infrastructure
Workforce
Conclusion
Acknowledgments
Appendix: Leading Causes of Mortality, Key Terms, Methodology
[1] Rural Hospitals Are Caught in an Aging-Infrastructure Conundrum
[2] Comprehensive Study of the Sullivan County Emergency Medical Services System, The Benjamin Center for Public Policy Initiatives at SUNY New Paltz, p. 21.
[3] Rural New York: Challenges and Opportunities, NYS Comptroller Thomas P. DiNapoli, September 2023.
[4] The Comptroller’s report used several criteria to select a sample group of 10 rural counties: 1) the U.S. Census Bureau classifies these counties as “unaffiliated,” and they are not part of a Metropolitan Statistical Area, a Micropolitan Statistical Area, a Combined Statistical Area (CSA), or a Core-Based Statistical Area (CBSA); 2) they do not have a city with a population of over 10,000 people; and 3) they are defined by the U.S. Office of Management and Budget (OMB) as non-metro counties. The 10 counties, Allegany, Chenango, Delaware, Essex, Greene, Hamilton, Lewis, Schuyler, Sullivan, and Wyoming, collectively comprise two percent of the New York’s 2021 population, but 22.7 percent of New York’s land area. See p. 4.
[5] https://bhw.hrsa.gov/workforce-shortage-areas/shortage-designation#hpsas
[6] The Kaiser Family Foundation (KFF) COVID-19 in Rural America – Is There Cause for Concern?, provides an analysis and interactive map examining COVID-19 cases and deaths as of April 27, 2020.
[7] City-Country Mortality Gap Widens Amid Persistent Holes in Rural Health Care Access, KFF Health News, April 9, 2024.
[8] Rural Americans are at higher risk of early death than urbanites: CDC, ABC News, April 30, 2024.
[9] In “The Nature of the Rural-Urban Mortality Gap”, USDA Economic Research Service, March 2024, “natural-cause mortality” is defined as “all causes of death except for those attributed to external causes of morbidity and mortality, such as causes from accidents, violence, legal actions, or surgical complications.” See p. 6. Such causes are distinguished by the associated International Classification of Disease, 10th revision (ICD-10) codes. Examples of natural-cause mortality include chronic diseases, acute illness, and pregnancy-related deaths, while examples of external-cause mortality include car crashes, assaults, suicide, and overdose.