Using Health Data and Information to Better Measure the Affordability of Healthcare
By Sally Dreslin and Adrienne Anderson
The complete accompanying slide deck is available on our website here, along with a PDF of this Issue Brief in the “Full Content Library” in our Writings tab.
Introduction
The Step Two Policy Project has been focusing recently on the affordability of healthcare, which needs to start with asking the question, "affordable for whom?" Before addressing that question for New York, we wanted to make some observations about how the question relates to another of our focus areas, which is the need for in-depth health data and information to better understand these complicated policy issues.
The lack of comprehensive health data, information, and policy analysis infrastructure in New York hampers the ability of policymakers to improve the healthcare delivery system, and health outcomes for our residents. Our Policy Brief in this area, Democratization of Health Data, Information and Policy Analysis, compared the general opacity of health data and information in New York to the robust health data infrastructure in Massachusetts. We argued that a prerequisite to effectively restructuring the healthcare delivery system in New York was a level of transparency that would enable policymakers and health stakeholders to better understand the system as it exists today so that we could chart a better course for the future. A follow-up Issue Brief in this area, Categories of Health Data and Information, identified specific categories of “health data and information” and the importance of integrating the data and information that currently reside in the silos of physical health, behavioral health, and health-related human services. Integration across all payers is essential to presenting a clear and comprehensive picture of New York’s healthcare delivery system.
The catalyst in Massachusetts in 2012 for developing a robust health data and information infrastructure was to support a statewide health expenditure growth target. Seven other states subsequently followed the lead of Massachusetts in creating healthcare expenditure growth targets, which also serve as something of a proxy for measuring the affordability of healthcare. At least in part because of the need to track and explain the growth in health expenditures, these states have each developed a health data and information infrastructure that provides a multifaceted understanding of healthcare delivery in their state. The programs in the states that support their health data infrastructure include Massachusetts’ Center for Health Information and Analysis and Health Policy Commission, Rhode Island’s Health Spending Accountability and Transparency Program, Connecticut’s Office of Health Strategy, Delaware’s Health Care Commission, Nevada’s Health Care Cost Growth Benchmark Program, New Jersey’s Office of Health Care Affordability and Transparency, Oregon’s Office of Health Policy, and Washington’s Health Care Cost Transparency Board.
The actual record of states with health expenditure and cost growth targets in controlling costs has been mixed. For example, in 2021, four out of five states that were studied exceeded their growth targets. So, it may be the case that the greatest benefit of establishing a health expenditure or cost growth target is the health data and information infrastructure itself. This infrastructure enables State policymakers and stakeholders to be smarter both tactically and strategically when developing, implementing, and evaluating healthcare policies. Although it undoubtedly is helpful to better understand the drivers of cost growth in the healthcare system, it will not necessarily result in reduced healthcare expenditures, because the reality is that states do not control all the levers contributing to healthcare cost growth, including the cost of labor, supplies, and pharmaceuticals.
Resources for Understanding the Growth of Healthcare Spending in New York
New York State does not publish an integrated picture of healthcare expenditures and cost growth in New York, and we have called for the creation of an Executive level Office of Health Data, Information, and Policy Analysis which could easily support such an infrastructure. In the absence of more easily accessible data and information in New York, we wanted to increase transparency and understanding of these issues based on other sources. We found that we could get a good start by taking advantage of the analytic suite made available through the Peterson-Milbank Program for Sustainable Health Care Costs. This valuable tool addresses such issues as:
Total Health Care Service Spending: Consumer and payer expenditures on health care services by sector and service category.
Hospital Finances: Hospital expenditures to provide services (e.g., personnel, overhead, administrative costs), as well as profit margins, uncompensated care costs, and net patient revenue.
Consumer Health Care Affordability: Consumer out-of-pocket spending on health care coverage and services.
Access to and Utilization of Health Care Services: Consumer access to health care services and service utilization by population type.
For each topic, the Peterson-Milbank Guide provides a brief overview of the type of data analysis that could be performed using a selection of relevant data sources from their inventory. The Guide recognizes that different types of users will have varying levels of need for (and the ability to use) the technical tools available to yield a deeper level of analysis.[1] Per the Guide, “The Guide does not address all data sources included in the Inventory. Analysts should refer to the Inventory for detailed instructions on how to access data sources, the types of information captured by these data sources, and relevant data limitations. For additional instructions on how states can analyze one or more data sources to spur policy action, please see the Peterson-Milbank resources, including:
Intermediate Data Analytic Guides (forthcoming);
A Data Use Strategy for State Action to Address Health Care Cost Growth from Bailit Health, and;
A Playbook for Implementing a State Health Care Cost Growth Target.”
The Step Two Policy Project has produced a version of the Peterson-Milbank Program’s slides customized to New York State, using the template provided in the Toolkit. These slides, titled, NYS Healthcare Costs and Affordability, as well as convenient links to the various elements of the Peterson-Milbank Program’s Toolkit, are available in a new “Resources” section of the Step Two Policy Project’s website. This Issue Brief discusses some of the data in the slides. The Appendix includes a glossary of relevant terms that explain the assumptions used in the various data sets (see Appendix: Glossary), as well as an abbreviated set of slides.
Statistics Relating to Healthcare Affordability, Spending, and Cost Growth in New York
Total health expenditures
The starting point for analyzing affordability is to understand the level of total health expenditures in New York and how that compares to other parts of the nation.
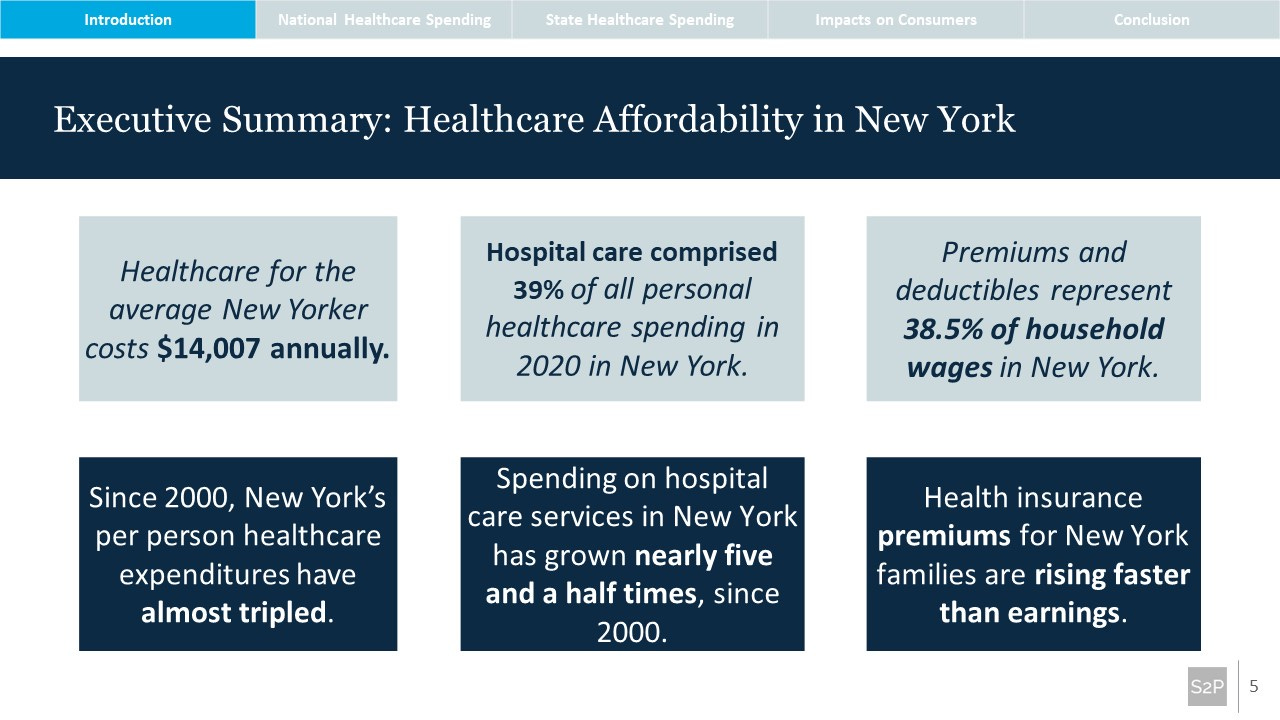
Total healthcare expenditures in New York in 2020 were $271 billion.[2] This represents approximately 6.6% of U.S. national healthcare expenditure (NHE) in 2020 of $4.1 trillion. Comparative data on total healthcare expenditures is included in slide 13 of the PowerPoint. This slide displays per capita healthcare expenditures in New York in 2020 as the highest in the nation at $14,007—37% higher than the national average. Per capita healthcare expenditures in New York are far above the national average of $10,191 but 18%, 12%, and 5.2% above the per capita healthcare expenditures of New Jersey, Connecticut, and Massachusetts, respectively. Notably, per capita health expenditures in California are almost exactly equal to the national average, at $10,299. The 179% growth in total health expenditures in New York over the 20 years from 2000 to 2020 was also greater than in our peer states.
Slide 14 includes a breakdown of healthcare spending in New York by category and slide 15 demonstrates growth in those categories over time. It is worth noting that although hospital costs are only about 25% of total Medicaid spending, 39% of all healthcare spending in New York is accounted for by hospital care (see Appendix: Glossary). The lower share in Medicaid reflects the fact that long-term care spending now accounts for the majority of Medicaid spending.
Affordability for Individuals with Different Types of Healthcare Coverage
Roughly 47% of New Yorkers are covered by Medicaid, CHIP, or the Essential Plan.[3] For all intents and purposes, Medicaid has no cost-sharing,[4] which also applies to the Essential Plans except for de minimis co-pays in a few situations. CHIP does have cost-sharing and higher income levels since CHIP enrollees are eligible for up to 400% of the federal poverty level (FPL).
Medicare covers another 13.5% of New Yorkers. Medicare coverage is organized into four parts, A, B, C, and D, and members can approach coverage through Original Medicare, with or without supplemental coverage, or with a Medicare Advantage plan:
Part A, hospital insurance, involves no co-insurance for the first 60 days of hospitalization within the benefit period, once a $1,632 inpatient deductible has been met.
Part B, medical insurance, has a $175 monthly premium and a 20% coinsurance rate after meeting a $240 deductible.
Part C, Medicare Advantage, is administered by third parties, and thus includes a range of potential cost-sharing for members, depending on the chosen plan. Medicare Advantage plans are alternatives to Original Medicare, and typically bundle coverage for Parts A, B, and D. Medicare members select their own Medicare Advantage plans (which limit annual out-of-pocket spending the way traditional commercial plans do). Some plans include vision, dental, and hearing benefits.
In lieu of Medicare Advantage, members with Original Medicare can elect to enroll in supplemental “Medigap” insurance plans, which can defray the cost sharing of Parts A and B, but a member cannot enroll in Medicare Advantage and Medigap plans simultaneously. Medigap insurance, however, is not technically “Part C.”
Part D, prescription drug coverage, is also administered through third parties, as a supplement to Original Medicare or as a component of a Medicare Advantage plan. Plan D coverage often carries deductibles and variable, tiered coinsurance rates for various drugs.
For the roughly 60% of New Yorkers who participate in these publicly funded health insurance programs, the primary challenge is not affordability, but rather access to providers who will accept the reimbursement levels of these programs. Other New Yorkers have various forms of commercial coverage or are uninsured (4.9%).
Commercial coverage for individuals (and their dependents) includes fully insured and self-insured plans through their employers. Some public employers, especially in New York City, provide coverage to their employees by paying for the purchase of individual plans on the New York State of Health (NYSOH), the State’s health plan marketplace.
Per the Health Insurance Coverage Update April 2023 released by NYSOH, 214,052 individuals purchased qualified health plans (QHPs) on the marketplace. The QHPs are for individuals who are not eligible for Medicaid, the Essential Plan, or for CHIP and who are otherwise eligible for coverage in New York. Two types of financial assistance are available for individuals who purchase QHPs, and they depend on income levels. Premium tax credits (PTCs) for individuals with incomes between 100 and 400% of FPL reduce the cost of premiums, and cost sharing reductions (CSRs) for eligible[5] individuals enrolled in Silver level plans reduce out-of-pocket costs, deductibles, and out-of-pocket maximums. During the COVID-19 Public Health Emergency, the federal government enhanced the PTCs by removing the ceiling of 400% of FPL and as a result, 130,847 New Yorkers benefitted from tax credits. Of this number, 25% of enrollees with incomes above 400% of FPL were eligible for PTCs.
Without the financial assistance for individuals, purchasing a QHP is not necessarily “affordable.” The product design of these policies includes deductibles and co-pays that assume on an actuarial basis that the individual will pay roughly 30% of the total cost, with insurance covering only the remaining 70% (which is known as the “actuarial value” of the policy). The result for many New Yorkers is that these individual policies almost represent what the industry refers to as “catastrophic” insurance. The same could be said about employer-sponsored plans with particularly high deductibles or co-pays. These additional charges frequently have the effect of inhibiting the consumer’s service utilization beyond the most basic preventive care and, at the other end of the spectrum, expensive hospital care that exceeds even relatively high deductibles and co-pays.
In 2020, the average employee deductible for single coverage in New York State was $1,821, up 10% from the prior year (i.e., 2019). In addition, the share of employees enrolled in self-funded employer-sponsored health insurance plans has been growing. Nationally, self-funded plans grew 5% overall from 2015 to 2021 and saw at least some growth in 88% of states. Unlike large group fully insured plans, which are subject to comprehensive benefit mandates imposed by states, self-funded plans can only be regulated by the federal government.
Slides 16-19 address the average cost and affordability of health care in New York. In 2021, the average family premium (for a representative family of four) in the commercial market was $27,107, of which the average deductible was $3,657. From 2011 to 2021, the cost of family health insurance premiums rose by 41.5%, while average family wage growth was only 33.4% over that same period. Although we don’t have long-term trended data for New York State, nationally, average employee contribution to the total cost of a premium increased by 326% over the last 24 years and now totals approximately $6,000 annually, or roughly a quarter of the total cost of a family premium. The available New York data, limited to an average over the three-years from 2020 to 2022, indicate an average employee contribution of $5,655 for family coverage. The overall cost burden of health insurance relative to average household wages in New York grew from 35% in 2011 to 38.5% in 2021, while the employee contribution as a percentage of average household wages rose from 3.6% in 2011 to 5.2% in 2021.
Medical Debt
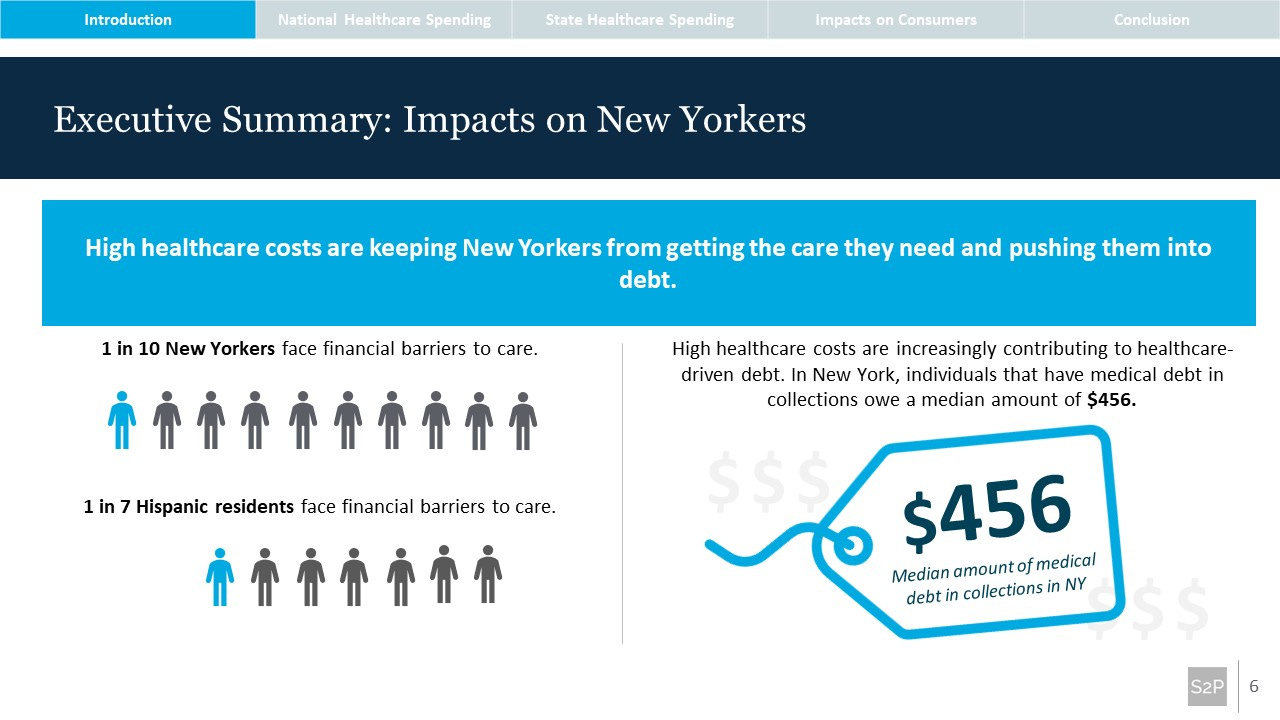
Slides 21 and 22 address medical debt in New York State, highlighting some of the personal financial risks associated with having medical debt in collections.
As we see from the slides that accompany this Issue Brief, medical debt often arises from an unexpected, one-time, or short-term medical episode. Given how many New Yorkers live from paycheck to paycheck, going for a medical visit is a real decision point for millions of people. When compared to the national data, New Yorkers are faring better with respect to medical debt. As we’ve discussed previously, though, the impact of the high costs of and limited access to healthcare on individuals who are not well-off and who do not have public or robust employer-sponsored health insurance coverage can be “buried under the law of averages.”
KFF Health News recently offered a striking examination of the negative cycle generated by individuals’ lack of health insurance and inability to manage the costs of medical care in a struggling, rural community in Oklahoma and the actions of the struggling, rural hospital – the sole community hospital. As the headline reads, “In This Oklahoma Town, Most Everyone Knows Someone Who’s Been Sued by the Hospital.” Many residents forgo seeking healthcare services for fear of being sued by the hospital over unpaid bills.
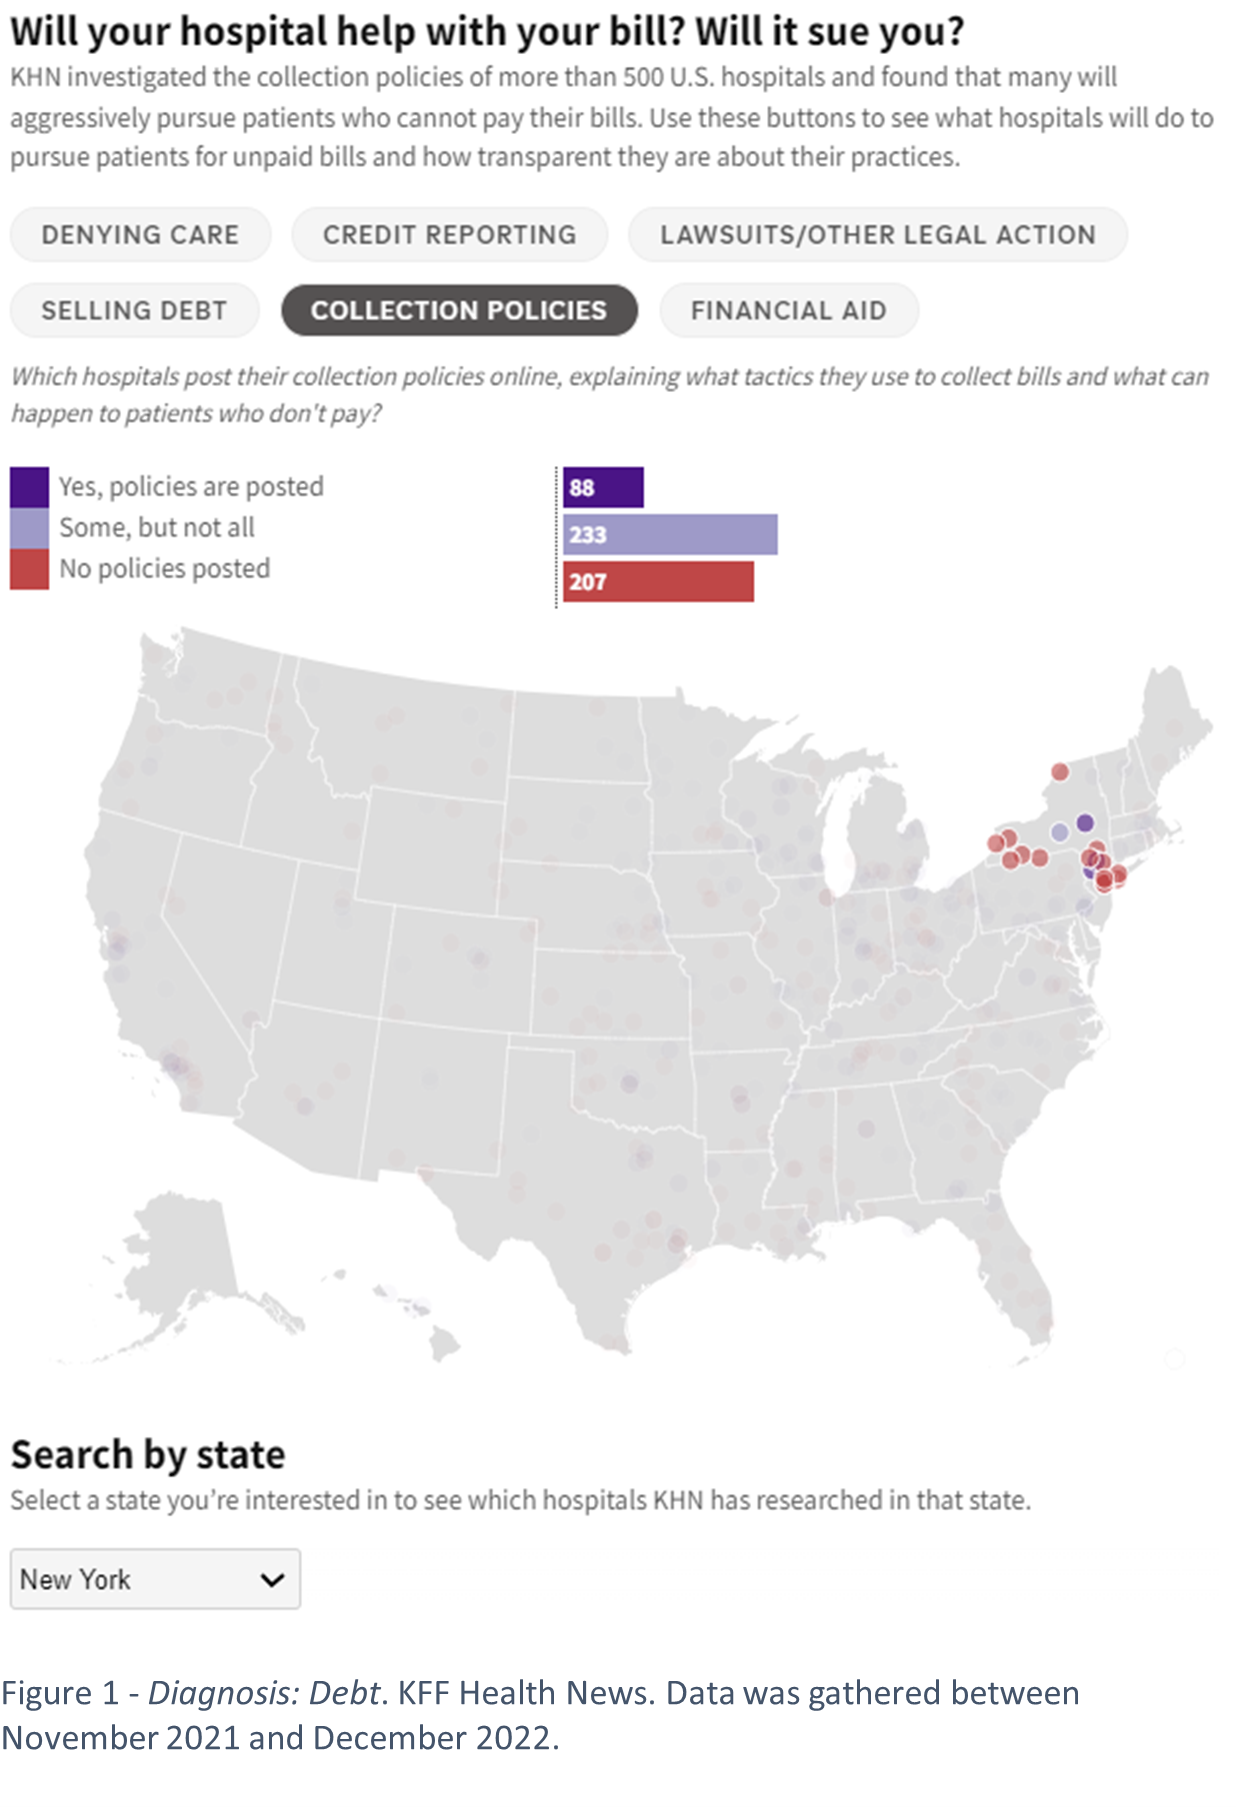
New York has enacted policies to address medical debt and manage healthcare affordability for individuals, and this year’s State of the State includes a “comprehensive plan to establish New York as a leading state in the fight against medical debt.” But as we see from the work done by KHN’s investigation into 500 U.S. Hospitals as part of their project with NPR called Diagnosis: Debt, there is still work to do related to related to denying care, credit reporting (now prohibited in New York), legal action, and selling debt when patients cannot pay their bills.
Spotlight on Affordability of Dental Care and Coverage
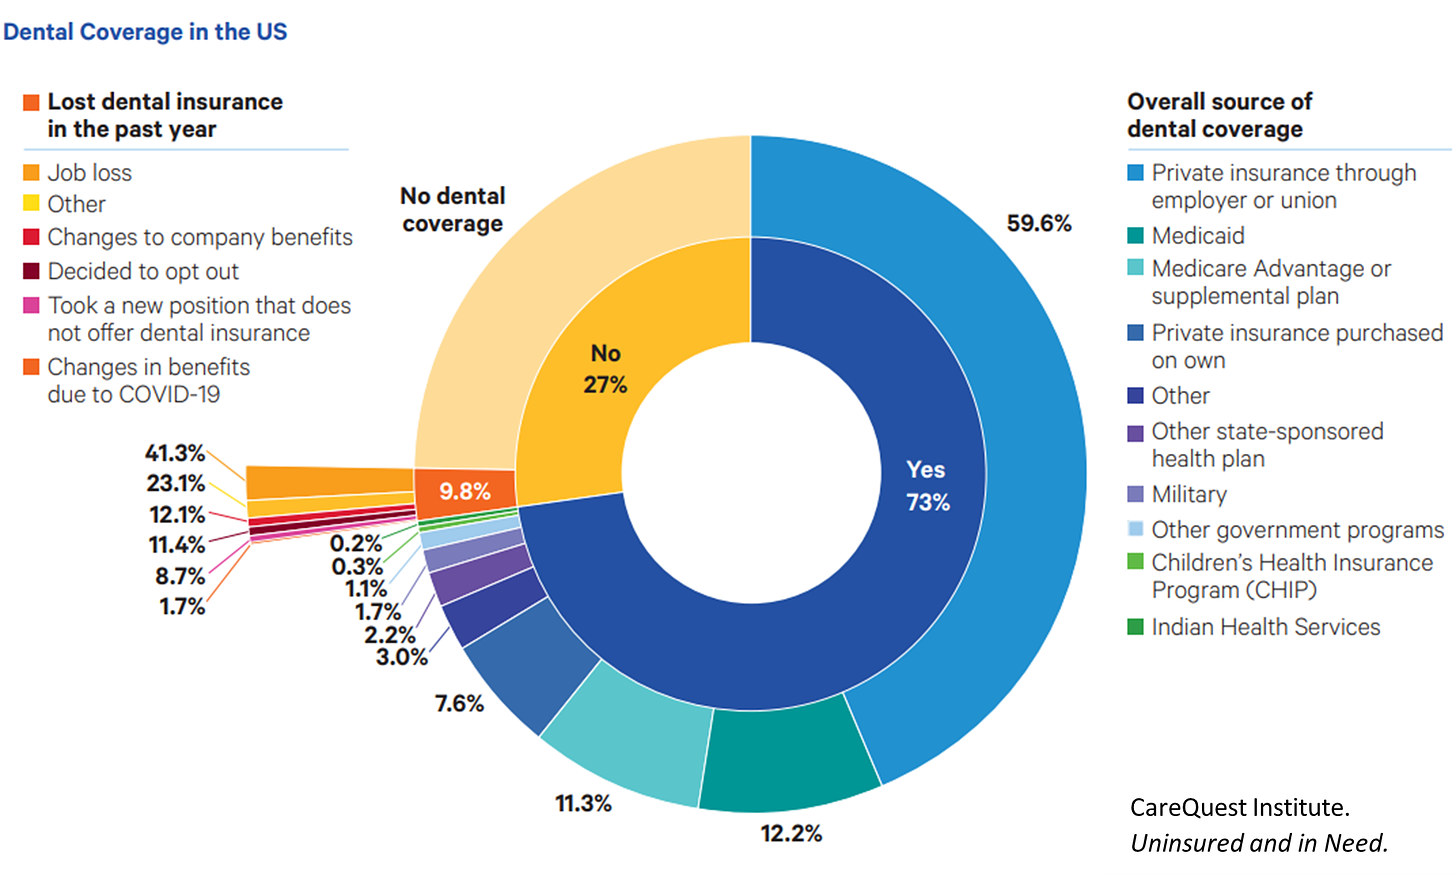
In addition to the healthcare affordability and access challenges described above, dental care can present particular challenges for New Yorkers across the state and all types of insurance coverage, but for differing reasons. While oral health is closely linked to many other health conditions, dental coverage is not an essential benefit under the Affordable Care Act, and health insurance plans are not required to cover dental services. According to an August 2023 report produced by CareQuest Institute for Oral Health, 73% of U.S. adults have dental insurance, compared with 90.7% of adults who have health insurance.
There are many barriers to accessing affordable, high-quality dental and oral care in New York, including lack of comprehensive private dental insurance coverage, low reimbursement for dental services in public insurance programs, uneven geographic distribution of dental care providers, limited access to fluoridation, and a lack of integration between dental care and physical health care. Rural New Yorkers struggle to find a dental provider – 92% of rural counties in New York are federally designated Health Professional Shortage Areas for Dental Care.
Dental care is covered by Medicaid, but relatively few dentists accept Medicaid.[6] StateWide Senior Action Council conducted an informal survey and found that “[O]f the roughly 3,000 people who responded, about 40% said that they couldn’t afford dental care, and 13% said they only received dental care through their local emergency facility. Dental supplies like toothbrushes, toothpaste, and floss were deemed too expensive by 22%.”[7]
In June 2023, the NYS Public Health and Health Planning Council’s Health Planning Committee discussed the utilization of emergency departments (EDs) and extended offloading times for EMS. They identified that 70% of New Yorkers visiting EDs have non-emergent conditions that could be treated in a less acute setting. Of those 70%, 15% of patients presented with non-traumatic dental complaints, meaning that 10.5% of all ED visits in New York are for potentially preventable, non-traumatic dental conditions. Additionally, the ED visit seldom addresses the specific dental issue. Instead, the typical treatment consists of pain medication, antibiotics, and a recommendation to follow up with a dentist.
It is difficult to get a clear picture of access and utilization of dental services because while various stakeholders periodically conduct surveys, there is little clear and consistent data available. The Healthcare Effectiveness Data and Information Set (HEDIS®) quality measure sets, a tool used by over 90% of U.S. health plans[8] that facilitates comparisons across plans, include three dental measures for children 2 to 20 years old (two of which were added in 2023), and zero measures for adults with dental benefits.[9] Dental care is often provided in Federally Qualified Health Centers (FQHCs) and School-Based Health Centers (SBHCs) in New York, and often the patients lack dental coverage. Patient and facility-level data are submitted to the State’s Statewide Planning and Research Cooperative System (SPARCS) that,
… collects patient-level detail on patient characteristics, diagnoses and treatments, services, and charges for each hospital inpatient stay and outpatient (ambulatory surgery, emergency department, and outpatient services) visit; and each ambulatory surgery and outpatient services visit to a hospital extension clinic and diagnostic and treatment center licensed to provide ambulatory surgery services.[10]
The healthcare and dental care services provided in these settings, which serve many New Yorkers who are uninsured or underinsured, are not identifiable in the SPARCS system. In the case of FQHCs, the data are not included in the public data sets and, in the case of the SBHCs, their data are mingled in with the Article 28 sponsor hospital data submissions and there is no identifiable information to indicate that a SBHC provided the services. This lack of data leads to an inability to develop nuanced information about the varying impacts of healthcare affordability and access in New York.
Conclusion
In our posting last week, on The Affordability of Healthcare in New York we made the observation that one of the challenges in understanding affordability is that individual experiences become obscured by the law of averages. For this reason, really understanding the question of healthcare affordability for individuals, particularly nuanced data is required.
While obtaining such nuanced data remains an aspirational goal, New York should start by ensuring that at least aggregate data is more readily available. In the meantime, the data included in this Issue Brief includes many of the foundational elements for the affordability analysis as it relates to taxpayers, employers, and individuals. Organizations such as the Peterson-Milbank Program for Sustainable Health Care Costs provide an important public service by increasing the transparency of healthcare data and information.
For a variety of reasons, including the large the number of New Yorkers who receive close to free healthcare coverage through publicly funded programs, addressing affordability by focusing on the growth of total health care expenditures has never become an organizing principle in New York State the way it has in at least eight other states in the nation. We continue to think that the right threshold step is for New York to create an Executive level entity that can provide more transparency about health data and information in New York, which will enable State policymakers to better understand the nature of the problem of healthcare affordability and design appropriate responses.
In the meantime, we will continue to rely on publicly available data tools focused on topics of healthcare affordability and access, and provide additional, New York-specific visualizations and materials similar to the slides in the Appendix.
Endnotes
[1] Per the Guide, “Users of this Guide should note that the level of difficulty associated with each data source is subjective and may vary based on personal experience. In general, [Low Difficulty] data sources often have online interactive tools to support analyses or can be analyzed with only minor manipulations to the underlying source data. [Medium Difficulty] data sources typically require additional manipulation, cleaning, or sub-setting before they can be used to generate insights and may require additional background knowledge or subject matter expertise to analyze. [High Difficulty] data sources generally require extensive manipulation and cleaning prior to analyses as well as relevant subject matter expertise, and often require analysts to use tools like SAS, R, or Stata to conduct analyses.”
[2] Note that in every case in this post, the year cited is the most recent year for which the information is widely available. If two data points from different sources are being compared, then the most recent year available for both values is used.
[3] This includes the 38.3% of New Yorkers enrolled in Medicaid, 2.3% enrolled in CHIP, and 6% enrolled in the Essential Plan. Undocumented individuals are not eligible for these programs even if they meet the income level criteria.
[4] Medicaid and CHIP Eligibility, Enrollment, and Cost Sharing Policies as of January 2020: Findings from a 50-State Survey
[5] Individuals and families with incomes between 200% and 250% of the Federal Poverty Level (FPL).
[6] Combating an Oral Health Crisis, Health Foundation for Western & Central New York.
[7] Ibid.
[8] Healthy People 2030, Healthcare Effectiveness Data and Information Set (HEDIS).
[9] HEDIS MY 2023: See What’s New, What’s Changed and What’s Retired.
[10] https://www.health.ny.gov/statistics/sparcs/
[11] See definition of family coverage in the Medical Expenditure Panel Survey Insurance Component (MEPS-IC) Glossary of Health Insurance Terms: https://datatools.ahrq.gov/meps-ic/glossary-health-insurance-terms/#Familycoverage
[12] State Health Expenditure Accounts: Methodology Paper, Definitions, Sources, and Methods. State of Provider Definitions and Methodology, 1980-2020. https://www.cms.gov/data-research/statistics-trends-and-reports/national-health-expenditure-data/state-residence
Appendix: Glossary of Terms Relevant to Healthcare Costs and Affordability Slide Deck
Deductible: the amount individuals and families are responsible for paying for covered health care services before their health insurance begins to cover service costs.
Employee Contribution (also, “Worker Contribution”): the amount an employee contributes to their (and, if applicable, their dependents’) healthcare coverage costs (typically referring to the premium), with the balance being covered by their employer.
Employer Contribution: the amount an employer contributes to the healthcare coverage costs of their employee (most typically referring to the premium), thereby subsidizing the coverage.
Family Coverage: a health plan that covers the enrollee and members of their immediate family (i.e., domestic partner or spouse and/or children). For this paper and the associated slides, family coverage is any coverage other than single and employee-plus-one (see definitions). Depending on family size and composition, some plans offer more than one rate for family coverage. If more than one rate is offered, “family coverage” data presented herein refer to costs for a family of four.
Hospital Care Spending: spending for all services hospitals provide to patients, including room and board, ancillary charges, services of resident physicians, drugs administered in the hospital, and any other services billed by hospitals.
Medical Debt: a balance an individual may owe for health care services after the payment due date. Some medical debt enters collections, although in New York State, providers are no longer allowed to report medical debt to credit agencies.
National Healthcare Expenditure (NHE): annual health care spending in the US across public and private funding sources and various sponsors (businesses, households, governments).
Other Personal Healthcare Spending: services that are generally delivered by providers in non-traditional settings such as schools, community centers, and the workplace, as well as by ambulance providers and residential mental health and substance abuse facilities.
Per Capita Healthcare Expenditures: annual health care spending across public and private funding sources and various sponsors (businesses, households, governments), divided by the relevant population size (e.g., a state’s spending divided by its population) to yield spending on a per-resident basis.
Physician and Clinical Services (Spending): spending on services provided in establishments operated by Doctors of Medicine (M.D.) and Doctors of Osteopathy (D.O.), outpatient care centers, plus the portion of medical laboratories services that are billed independently by the laboratories. This category also includes services rendered by an M.D. or D.O. in hospitals if the physician bills independently for those services. Clinical services provided in freestanding outpatient clinics operated by the U.S. Department of Veterans’ Affairs, the U.S. Coast Guard Academy, the U.S. Department of Defense, and the U.S. Indian Health Service are also included.
Premium: the amount policyholders pay for health insurance coverage monthly. Policyholders must pay premiums regardless of whether they visit a doctor or use any other health care service. Premiums are typically paid by one or a combination of: the policyholder/employee, employer, or union (if applicable).
Single Coverage: insurance coverage held by an individual for that individual only.
Appendix: Selected Slides
The complete accompanying slide deck is available on our website here, along with a PDF of this Issue Brief in the “Full Content Library” in our Writings tab.


